
From Santa Clarita to Malibu, the numbers reveal where drivers were cited most often for using a handheld phone behind the wheel.
Between 2020 and 2023, some Los Angeles County cities saw far more handheld cell phone driving citations than others.
A review of citation data for Vehicle Code 23123(a) shows clear patterns: a few cities stand out with especially high totals, and in many places, enforcement appears to be concentrated on just a handful of major roads.
For drivers, that matters. These numbers offer a useful look at where citations are happening most often and which roads appear to draw the most attention.
A person shall not drive a motor vehicle while using a wireless telephone unless that telephone is specifically designed and configured to allow hands-free listening and talking, and is used in that manner while driving.
California Legislative Information Tweet

Santa Clarita Stands Out by a Wide Margin
Among the top 10 cities in this dataset, Santa Clarita had by far the highest number of citations, with 9,855 issued between 2020 and 2023.
That total is striking. The next closest city, Palmdale, had 2,371 citations during the same period. In other words, Santa Clarita had more than four times as many citations as the second-highest city on the list.
Santa Clarita’s numbers were also consistently high every year:
- 2020: 2,152
- 2021: 2,589
- 2022: 2,872
- 2023: 2,242
This suggests that the issue was not limited to one unusual year. Santa Clarita remained a major hotspot throughout the full four-year period.
Some Cities Show a Broad Pattern, Others Point to One Main Road
One of the most interesting takeaways from the data is that citation activity does not look the same in every city.
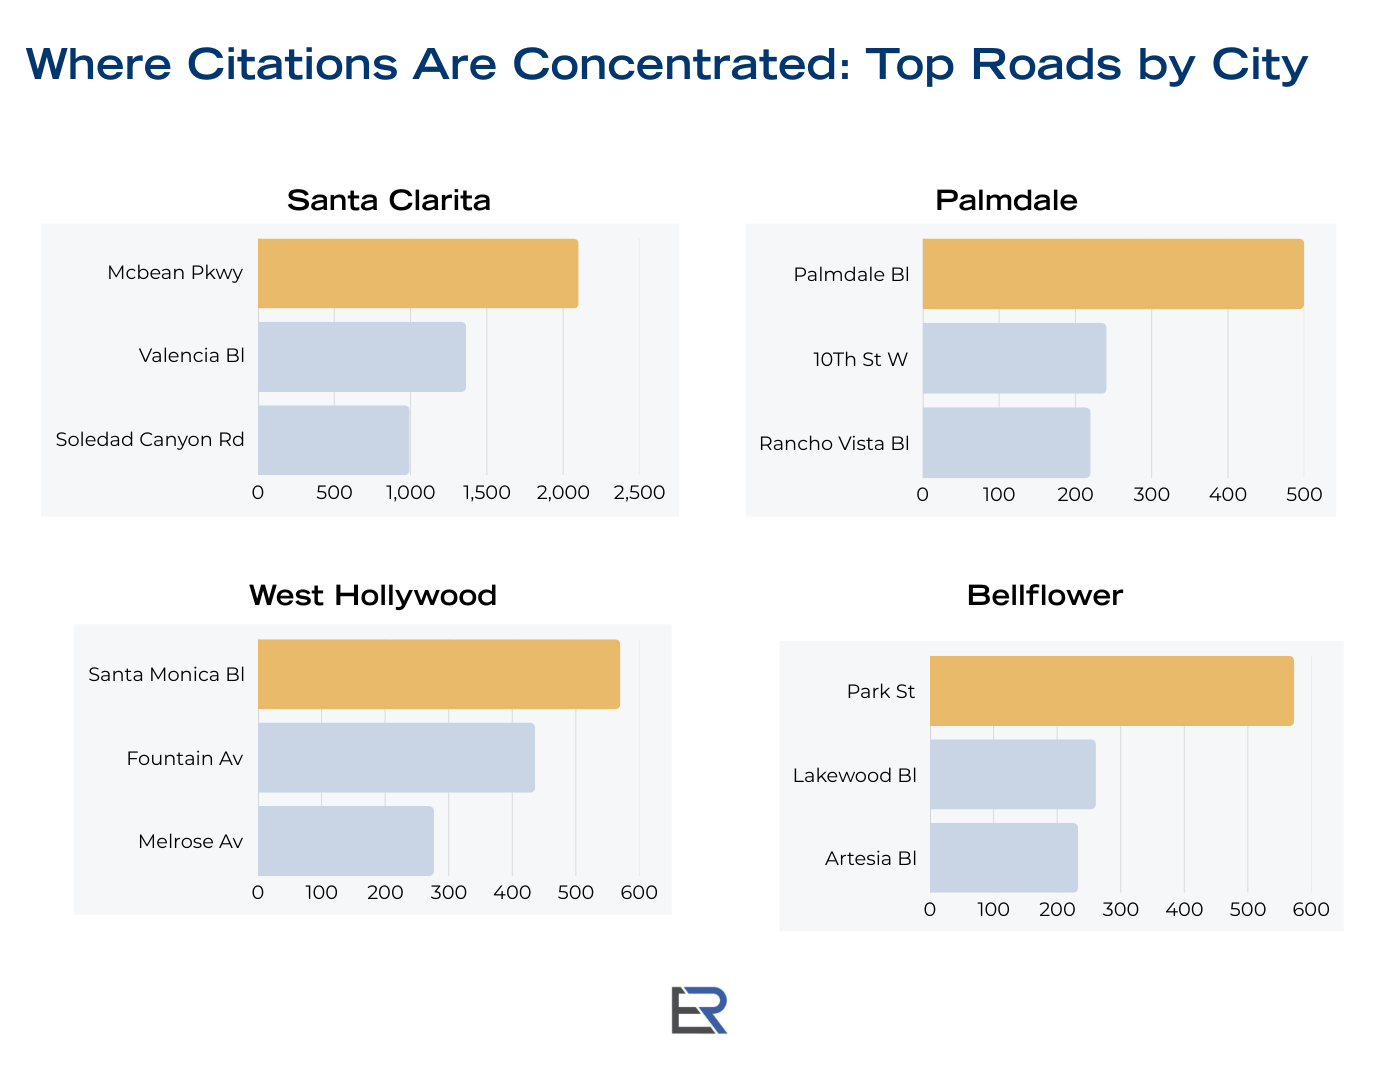
In Santa Clarita, citations were spread across several major roads, including:
- McBean Parkway: 2,102
- Valencia Boulevard: 1,365
- Soledad Canyon Road: 994
That pattern suggests a broader enforcement trend across the city rather than one single trouble spot.
But in other cities, the data tells a much narrower story.
Recommended Reading: Can Cell Phone Records Be Used Against You?
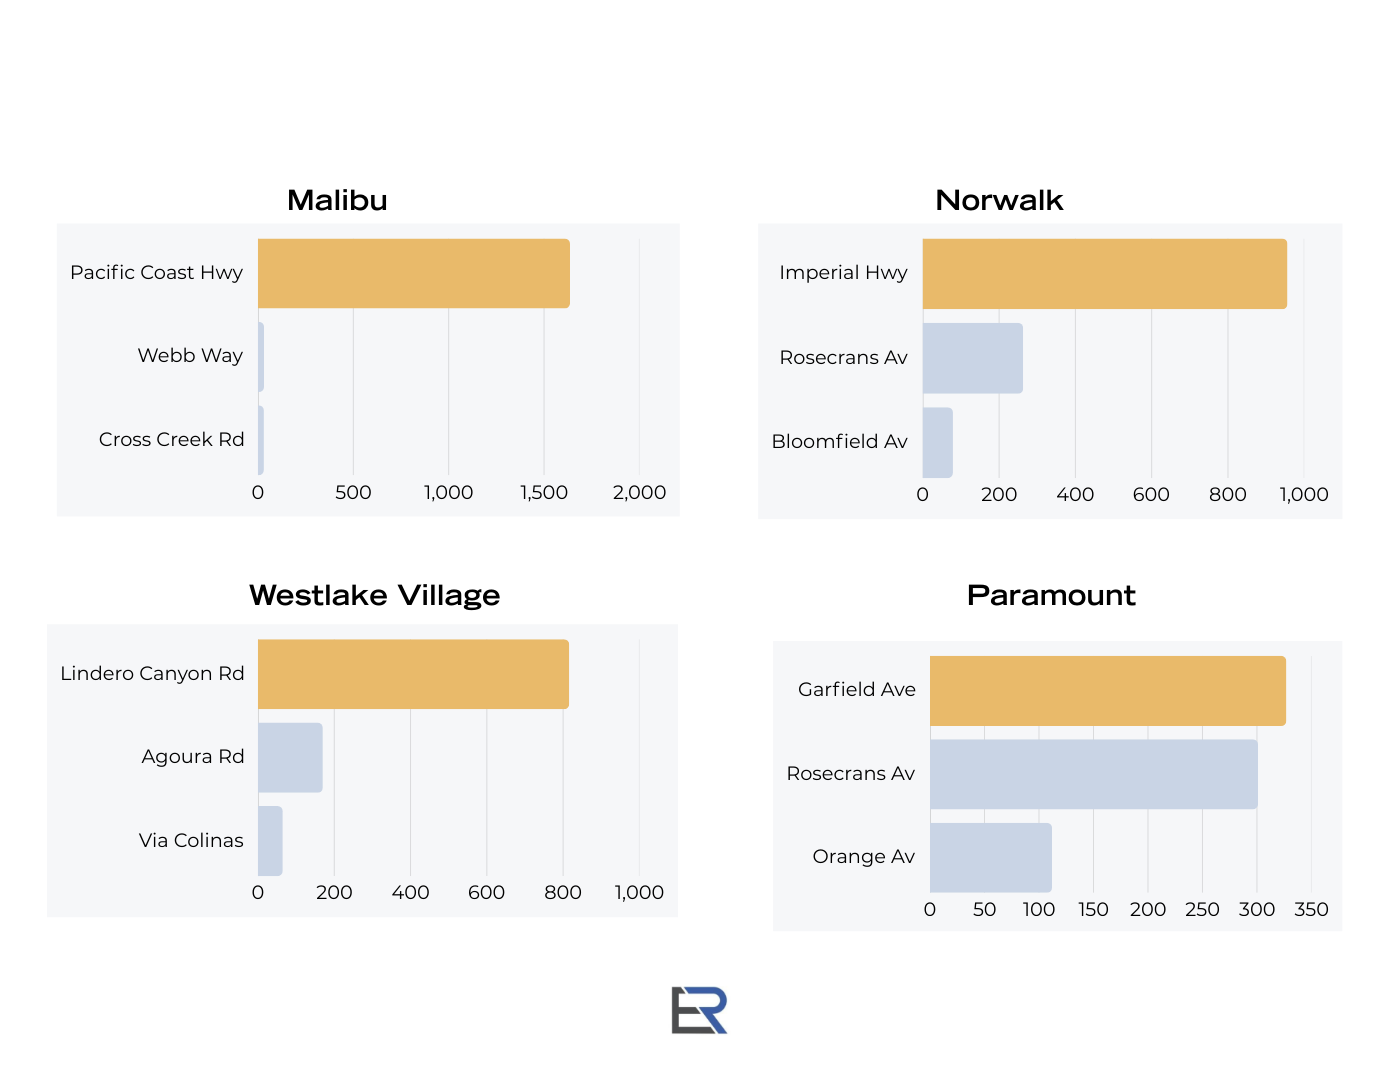
Malibu Is Dominated by Pacific Coast Highway
In Malibu, one road stands far above the rest: Pacific Coast Highway.
Out of 1,805 total citations issued in Malibu from 2020 to 2023, 1,636 happened on Pacific Coast Highway.
That means roughly 91% of all citations in Malibu in this dataset came from just one roadway.
For anyone familiar with Malibu traffic, that number may not be surprising. Pacific Coast Highway is one of the area’s best-known and busiest routes. Still, the concentration is hard to ignore.
Other Cities Also Show Strong Roadway Concentration
Malibu is the most dramatic example, but it is not the only city where one road appears to account for a large share of citations.
Here are a few other examples:
- Norwalk:
- Imperial Highway: 956 out of 1,691
- Imperial Highway: 956 out of 1,691
- Westlake Village:
- Lindero Canyon Road: 816 out of 1,187
- Lindero Canyon Road: 816 out of 1,187
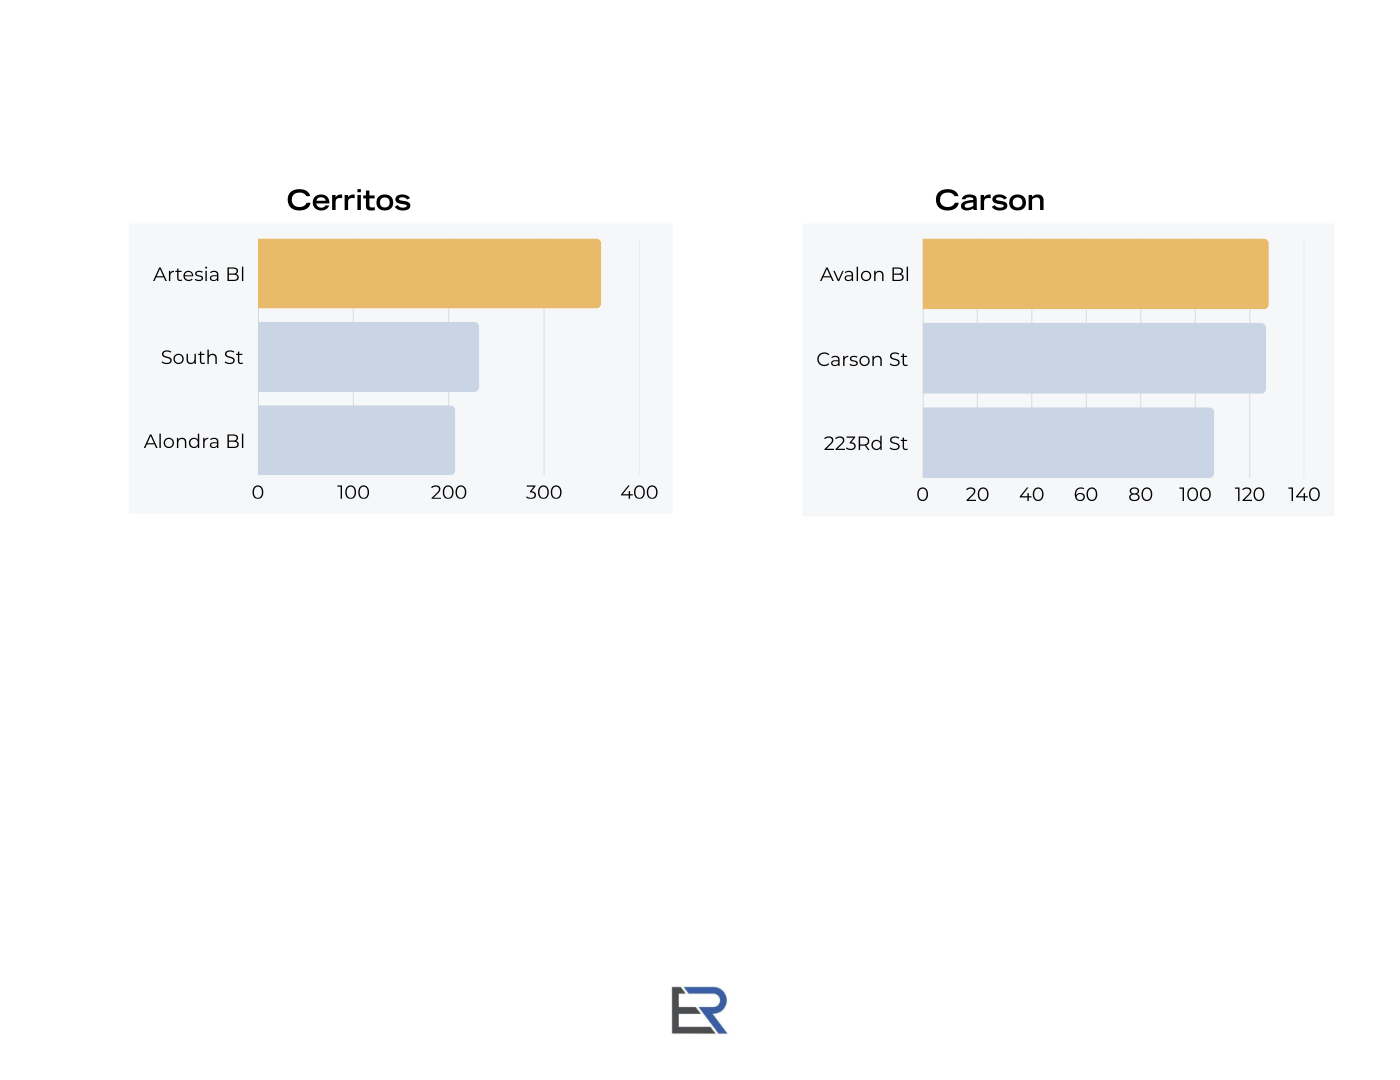
- Cerritos:
- Artesia Boulevard: 360 out of 1,046
- Artesia Boulevard: 360 out of 1,046
- Paramount:
- Garfield Avenue: 327
- Rosecrans Avenue: 301
- Garfield Avenue: 327
- Carson:
- Avalon Boulevard: 127
- Carson Street: 126
- 223rd Street: 107
- Avalon Boulevard: 127
This pattern suggests that in many cities, handheld cell phone driving citations tend to cluster along major commuter corridors and heavily traveled streets, not randomly across all roads.
Citation Trends Changed From Year to Year
The yearly breakdown also shows that citation patterns shifted over time.
Some cities climbed or stayed strong:
- Malibu rose from 302 citations in 2020 to 641 in 2022, then stayed high at 504 in 2023.
- Norwalk reached its highest total in 2023, with 651 citations.
- Westlake Village jumped sharply after 2020 and remained elevated through 2023.
Other cities trended downward:
- West Hollywood dropped from 783 citations in 2020 to 223 in 2023.
- Bellflower fell from a high of 765 in 2021 to 136 in 2023.
- Paramount declined from 441 in 2020 to 103 in 2023.
These differences matter because they show there was no single countywide pattern. Some cities were moving up while others were moving down.

What Can We Reasonably Take From This?
This data reveals a few things with confidence.
First, some cities issue far more handheld cell phone driving citations than others. Santa Clarita clearly leads this group, and several other cities show notable citation activity as well.
Second, certain roads appear to be repeat enforcement zones. In places like Malibu, Norwalk, and Westlake Village, one road accounts for a very large share of all citations.
Third, the changes over time suggest that local factors matter. Traffic flow, road design, enforcement priorities, and driving patterns may all play a role.
What the Data Does Not Prove
At the same time, it is important not to read too much into the numbers.
This dataset does not tell us:
- whether drivers in one city are more distracted than drivers elsewhere
- whether some police agencies enforced the law more aggressively
- whether traffic volume explains the higher citation counts
- whether road design or commuting patterns caused the differences
The data shows where citations were issued most often. It does not fully explain why.
Why This Matters for Drivers in Los Angeles County
For drivers, the takeaway is simple: where you drive can make a big difference.
If you regularly travel on roads like Pacific Coast Highway, McBean Parkway, Imperial Highway, or Lindero Canyon Road, this data suggests those are places where enforcement may be more active.
And even beyond enforcement, the larger point is worth remembering: using a handheld phone while driving creates risk. A citation may be the immediate consequence, but distraction behind the wheel can also lead to serious crashes and injuries.
Recommended Reading: California’s 2025 No-Touch Law: What Los Angeles Drivers Need to Know